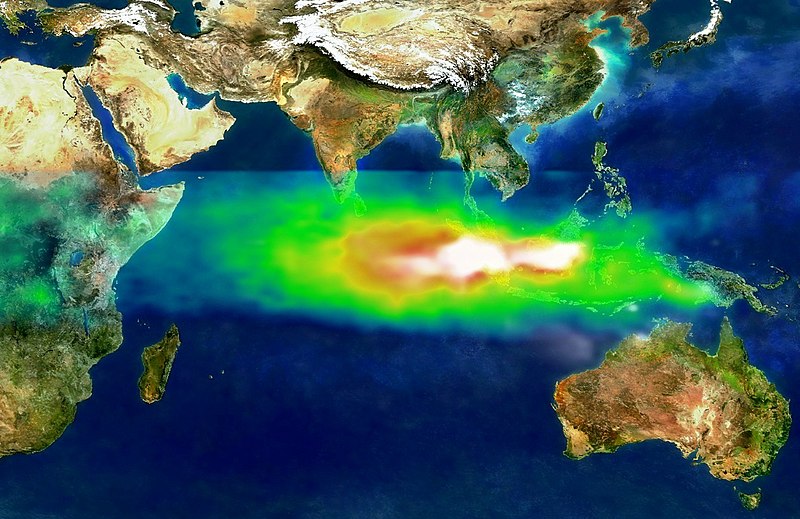
File:TOMS indonesia smog lrg.jpg
外觀

預覽大小:800 × 519 像素。 其他解析度:320 × 208 像素 | 640 × 415 像素 | 1,024 × 665 像素 | 1,234 × 801 像素。
原始檔案 (1,234 × 801 像素,檔案大小:337 KB,MIME 類型:image/jpeg)
檔案歷史
點選日期/時間以檢視該時間的檔案版本。
| 日期/時間 | 縮圖 | 尺寸 | 使用者 | 備註 | |
|---|---|---|---|---|---|
| 目前 | 2013年9月12日 (四) 10:18 |  | 1,234 × 801(337 KB) | Soerfm | Crop, contrast |
| 2005年9月8日 (四) 00:58 |  | 1,280 × 960(456 KB) | SEWilco | This image shows the pollution over Indonesia and the Indian Ocean on October 22, 1997. White represents the aerosols (smoke) that remained in the vicinity of the fires. Green, yellow, and red pixels represent increasing amounts of tropospheric ozone (smo |
檔案用途
下列4個頁面有用到此檔案:
全域檔案使用狀況
以下其他 wiki 使用了這個檔案:
- ar.wikipedia.org 的使用狀況
- cs.wikipedia.org 的使用狀況
- de.wikipedia.org 的使用狀況
- en.wikipedia.org 的使用狀況
- fi.wikipedia.org 的使用狀況
- fi.wikinews.org 的使用狀況
- fr.wikipedia.org 的使用狀況
- id.wikipedia.org 的使用狀況
- ig.wikipedia.org 的使用狀況
- it.wikipedia.org 的使用狀況
- mk.wikipedia.org 的使用狀況
- ms.wikipedia.org 的使用狀況
- ru.wikipedia.org 的使用狀況
- ru.wikinews.org 的使用狀況
- simple.wikipedia.org 的使用狀況
- sv.wikipedia.org 的使用狀況
- ta.wikipedia.org 的使用狀況
- uk.wikipedia.org 的使用狀況
- vi.wikipedia.org 的使用狀況


