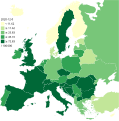
File:Persons died due to coronavirus COVID-19 per capita in Europe.svg
外观

此SVG文件的PNG预览的大小:592 × 599像素。 其他分辨率:237 × 240像素 | 474 × 480像素 | 759 × 768像素 | 1,012 × 1,024像素 | 2,024 × 2,048像素 | 1,440 × 1,457像素。
原始文件 (SVG文件,尺寸为1,440 × 1,457像素,文件大小:1.19 MB)
文件历史
点击某个日期/时间查看对应时刻的文件。
| 日期/时间 | 缩略图 | 大小 | 用户 | 备注 | |
|---|---|---|---|---|---|
| 当前 | 2022年2月7日 (一) 11:24 |  | 1,440 × 1,457(1.19 MB) | Antondimak | Updated to 5 February 2022 |
| 2021年5月22日 (六) 16:27 |  | 1,440 × 1,457(1.19 MB) | Antondimak | Updated to 21 May 2021. | |
| 2021年3月28日 (日) 16:25 |  | 1,440 × 1,457(1.19 MB) | Antondimak | Updated to 27 March 2021. | |
| 2021年3月6日 (六) 10:09 |  | 1,440 × 1,457(1.19 MB) | Antondimak | Updated to 4 March 2021. | |
| 2021年1月3日 (日) 17:02 |  | 1,440 × 1,457(1.19 MB) | Antondimak | Updated to 2 January 2021. | |
| 2021年1月1日 (五) 22:48 |  | 1,440 × 1,457(1.19 MB) | Antondimak | Added threshold. | |
| 2021年1月1日 (五) 22:19 |  | 1,440 × 1,457(1.19 MB) | Antondimak | Updated to 31 December 2020. | |
| 2020年12月10日 (四) 21:24 |  | 1,440 × 1,457(1.19 MB) | Antondimak | Updated to 9 December 2020. | |
| 2020年11月24日 (二) 22:15 |  | 1,440 × 1,457(1.19 MB) | Antondimak | The data were from the 23rd | |
| 2020年11月24日 (二) 22:14 |  | 1,440 × 1,457(1.19 MB) | Antondimak | Updated to 24 November and changed the scale, as there were no countries remaining in the lowest category. |
文件用途
以下页面使用本文件:
全域文件用途
以下其他wiki使用此文件:
- el.wikipedia.org上的用途
- en.wikipedia.org上的用途
- en.wikibooks.org上的用途
- en.wikiversity.org上的用途
- it.wikipedia.org上的用途
- ja.wikipedia.org上的用途
- ms.wikipedia.org上的用途
- nl.wikipedia.org上的用途
- pl.wikipedia.org上的用途
- pt.wikipedia.org上的用途
- sq.wikipedia.org上的用途
- sv.wikipedia.org上的用途
- th.wikipedia.org上的用途
- tl.wikipedia.org上的用途
- uk.wikipedia.org上的用途
- vi.wikipedia.org上的用途

