File:NonConvex.gif
页面内容不支持其他语言。
外观
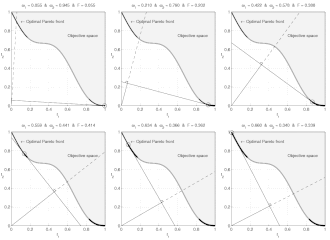
NonConvex.gif (360 × 392像素,文件大小:782 KB,MIME类型:image/gif、循环、84帧、4.2秒)
摘要
| 描述NonConvex.gif |
English: Weighted-sum approach is an easy method used to solve multi-objective optimization problem. It consists in aggregating the different optimization functions in a single function. However, this method only allows to find the supported solutions of the problem (i.e. points on the convex hull of the objective set). This animation shows that when the outcome set is not convex, not all efficient solutions can be found
Français : La méthode des sommes pondérées est une méthode simple pour résoudre des problèmes d'optimisation multi-objectif. Elle consiste à aggréger l'ensemble des fonctions dans une seule fonction avec différents poids. Toutefois, cette méthode permet uniquement de trouver les solutions supportées (càd les points non-dominés appartenant à l'enveloppe convexe de l'espace d'arrivée). Cette animation montre qu'il n'est pas possible d'identifier toutes les solutions efficaces lorsque l'espace d'arrivée est n'est pas convexe. |
| 日期 | |
| 来源 | 自己的作品 |
| 作者 | Guillaume Jacquenot |
Source code (MATLAB)
function MO_Animate(varargin)
% This function generates objective space images showing why
% sum-weighted optimizer can not find all non-dominated
% solutions for non convex objective spaces in multi-ojective
% optimization
%
% Guillaume JACQUENOT

if nargin == 0
    % Simu = 'Convex';
    Simu = 'NonConvex';
    save_pictures = true;
    interpreter = 'none';
end

switch Simu
    case 'NonConvex'
        a = 0.1;
        b = 3;
        stepX = 1/200;
        stepY = 1/200;
    case 'Convex'
        a = 0.2;
        b = 1;
        stepX = 1/200;
        stepY = 1/200;
end

[X,Y] = meshgrid( 0:stepX:1,-2:stepY:2);

F1 = X;
F2 = 1+Y.^2-X-a*sin(b*pi*X);

figure;
grid on;
hold on;
box on;
axis square;
set(gca,'xtick',0:0.2:1);
set(gca,'ytick',0:0.2:1);

Ttr = get(gca,'XTickLabel');
Ttr(1,:)='0.0';
Ttr(end,:)='1.0';
set(gca,'XTickLabel',[repmat(' ',size(Ttr,1),1) Ttr]);

Ttr = get(gca,'YTickLabel');
Ttr(1,:)='0.0';
Ttr(end,:)='1.0';
set(gca,'YTickLabel',[repmat(' ',size(Ttr,1),1) Ttr]);

if strcmp(interpreter,'none')
    xlabel('f1','Interpreter','none');
    ylabel('f2','Interpreter','none','rotation',0);
else
    xlabel('f_1','Interpreter','Tex');
    ylabel('f_2','Interpreter','Tex','rotation',0);
end

set(gcf,'Units','centimeters')
set(gcf,'OuterPosition',[3 3 3+6 3+6])
set(gcf,'PaperPositionMode','auto')

[minF2,minF2_index] = min(F2);
minF2_index = minF2_index + (0:numel(minF2_index)-1)*size(X,1);

O1 = F1(minF2_index)';
O2 = minF2';

[pF,Pareto]=prtp([O1,O2]);

fill([O1( Pareto);1],[O2( Pareto);1],repmat(0.95,1,3));

text(0.45,0.75,'Objective space');
text(0.1,0.9,'\leftarrow Optimal Pareto front','Interpreter','TeX');

plot(O1( Pareto),O2( Pareto),'k-','LineWidth',2);
plot(O1(~Pareto),O2(~Pareto),'.','color',[1 1 1]*0.8);
V1 = O1( Pareto); V1 = V1(end:-1:1);
V2 = O2( Pareto); V2 = V2(end:-1:1);

O1P = O1( Pareto);
O2P = O2( Pareto);

O1PC = [O1P;max(O1P)];
O2PC = [O2P;max(O2P)];
ConvH = convhull(O1PC,O2PC);
ConvH(ConvH==numel(O2PC))=[];
c = setdiff(1:numel(O1P), ConvH);

% Non convex
O1PNC = O1PC(c);

[temp, I1] = min(O1PNC);
[temp, I2] = max(O1PNC);

if ~isempty(I1) && ~isempty(I2)
    plot(O1PC(c),O2PC(c),'-','color',[1 1 1]*0.7,'LineWidth',2);
end

p1 = (V2(1)-V2(2))/(V1(1)-V1(2));
hp = plot([0 1],[p1*(-V1(1))+V2(1) p1*(1-V1(1))+V2(1)]);
delete(hp);

Histo_X = [];
Histo_Y = [];
coeff = 0.02;
Sq1 = coeff *[0 1 1 0 0;0 0 1 1 0];
compt = 1;
for i = 2:1:length(V1)-1
    if ismember(i,ConvH)
        p1 = (V2(i+1)-V2(i-1))/(V1(i+1)-V1(i-1));
        x_inter = 1/(1+p1^2)*(p1^2*V1(i)-p1*V2(i));
        hp1 = plot([0 1],[p1*(-V1(i))+V2(i) p1*(1-V1(i))+V2(i)],'k');
        % hp2 = plot([x_inter],[-x_inter/p1],'k','Marker','.','MarkerSize',8)
        hp3 = plot([0 x_inter],[0 -x_inter/p1],'k-');
        hp4 = plot([x_inter 1],[-x_inter/p1 -1/p1],'k--');
        hp5 = plot(V1(i),V2(i),'ko','MarkerSize',10);

        % Plot the square for perpendicular lines
        alpha = atan(-1/p1);
        Mrot = [cos(alpha) -sin(alpha);sin(alpha) cos(alpha)];
        Sq_plot = repmat([x_inter;-x_inter/p1],1,5) + Mrot * Sq1;
        hp7 = plot(Sq_plot(1,:),Sq_plot(2,:),'k-');

        Histo_X = [Histo_X V1(i)];
        Histo_Y = [Histo_Y V2(i)];
        hp6 = plot(Histo_X,Histo_Y,'k.','MarkerSize',10);

        w1 = p1/(p1-1);
        w2 = 1-w1;
        Fweight_sum = V1(i)*w1+w2*V2(i);
        Fweight_sum = floor(1e3*Fweight_sum )/1e3;

        w1 = floor(1000*w1)/1e3;
        str1 = sprintf('%.3f',w1);
        str2 = sprintf('%.3f',1-w1);
        str3 = sprintf('%.3f',Fweight_sum);
        if (strcmp(str1,'0.500')||strcmp(str1,'0,500')) && strcmp(Simu,'NonConvex')
            disp('Two solutions');
        end
        title(['\omega_1 = ' str1 '  &  \omega_2 = ' str2 '  &  F = ' str3],'Interpreter','TeX');
        axis([0 1 0 1]);
        file = ['Frame' num2str(1000+compt)];
        if save_pictures
            saveas(gcf, file, 'epsc');
        end
        compt = compt +1;
        pause(0.001);
        delete(hp1);
        delete(hp3);
        delete(hp4);
        delete(hp5);
        delete(hp6);
        delete(hp7);
    end
end
disp(['Number of frames :' num2str(length(V1))]);
return;

function [A varargout]=prtp(B)
% Let Fi(X), i=1...n, are objective functions
% for minimization.
% A point X* is said to be Pareto optimal one
% if there is no X such that Fi(X)<=Fi(X*) for
% all i=1...n, with at least one strict inequality.
% A=prtp(B),
% B - m x n input matrix: B=
% [F1(X1) F2(X1) ... Fn(X1);
%  F1(X2) F2(X2) ... Fn(X2);
%  .......................
%  F1(Xm) F2(Xm) ... Fn(Xm)]
% A - an output matrix with rows which are Pareto
% points (rows) of input matrix B.
% [A,b]=prtp(B). b is a vector which contains serial
% numbers of matrix B Pareto points (rows).
% Example.
% B=[0 1 2; 1 2 3; 3 2 1; 4 0 2; 2 2 1;...
%    1 1 2; 2 1 1; 0 2 2];
% [A b]=prtp(B)
% A =
%      0     1     2
%      4     0     2
%      2     2     1
% b =
%      1     4     7
A=[]; varargout{1}=[];
sz1=size(B,1);
jj=0; kk(sz1)=0;
c(sz1,size(B,2))=0;
bb=c;
for k=1:sz1
    j=0;
    ak=B(k,:);
    for i=1:sz1
        if i~=k
            j=j+1;
            bb(j,:)=ak-B(i,:);
        end
    end
    if any(bb(1:j,:)'<0)
        jj=jj+1;
        c(jj,:)=ak;
        kk(jj)=k;
    end
end
if jj
  A=c(1:jj,:);
  varargout{1}=kk(1:jj);
else
  warning([mfilename ':w0'],...
    'There are no Pareto points. The result is an empty matrix.')
end
return;
The weighted-sum approach minimizes function 

where


such that


To have a non-convex outcome set, parameters 


Weights 


![{\displaystyle \omega _{1}\in [0;1]~}](https://wikimedia.org/api/rest_v1/media/math/render/svg/99c8913e84daf282e85b04849cc18cc14594dda7)

许可协议
我,本作品著作权人,特此采用以下许可协议发表本作品:

|
已授权您依据自由软件基金会发行的无固定段落及封面封底文字(Invariant Sections, Front-Cover Texts, and Back-Cover Texts)的GNU自由文件许可协议1.2版或任意后续版本的条款,复制、传播和/或修改本文件。该协议的副本请见“GNU Free Documentation License”。http://www.gnu.org/copyleft/fdl.htmlGFDLGNU Free Documentation Licensetruetrue |
- 您可以自由地:
- 共享 – 复制、发行并传播本作品
- 修改 – 改编作品
- 惟须遵守下列条件:
- 署名 – 您必须对作品进行署名,提供授权条款的链接,并说明是否对原始内容进行了更改。您可以用任何合理的方式来署名,但不得以任何方式表明许可人认可您或您的使用。
- 相同方式共享 – 如果您再混合、转换或者基于本作品进行创作,您必须以与原先许可协议相同或相兼容的许可协议分发您贡献的作品。
您可以选择您需要的许可协议。
说明
添加一行文字以描述该文件所表现的内容
此文件中描述的项目
描繪內容
某些值没有维基数据项目
GNU自由文档许可证1.2或更高版本 简体中文(已转写)
知识共享署名-相同方式共享1.0通用 简体中文(已转写)
知识共享署名-相同方式共享2.0通用 简体中文(已转写)
知识共享署名-相同方式共享2.5通用 简体中文(已转写)
8 3 2009
文件历史
点击某个日期/时间查看对应时刻的文件。
| 日期/时间 | 缩略图 | 大小 | 用户 | 备注 | |
|---|---|---|---|---|---|
| 当前 | 2009年3月8日 (日) 17:13 |  | 360 × 392(782 KB) | Gjacquenot | {{Information |Description={{en|1=Weighted-sum approach is an easy method used to solve multi-objective optimization problem. It consists in aggregating the different optimization functions in a single function. However, this method only allows to find th |
文件用途
以下页面使用本文件:
全域文件用途
以下其他wiki使用此文件:
- ar.wikipedia.org上的用途
- az.wikipedia.org上的用途
- de.wikipedia.org上的用途
- el.wikipedia.org上的用途
- en.wikipedia.org上的用途
- pt.wikipedia.org上的用途
- ru.wikipedia.org上的用途
- sr.wikipedia.org上的用途
隐藏分类:


